Human Eye
The recipient of the light emitted by most visible-spectrum LEDs is the human eye. Figure 16.1 (a) shows a schematic illustration of the human eye (Encyclopedia Britannica, 1994).
Fig 16.1. Light receptors of the human eye
The inside of the eyeball is clad by the retina, which is the light-sensitive part of the eye. The illustration also shows the Fovea (Yellow spot), a cone-rich central region of the retina which affords the high acuteness of central vision. Figure 16.1 (b) shows the cell structure of the retina including the light-sensitive rod cells and cone cells. Also shown are the ganglion cells and nerve fibers that transmit the visual information to the brain. Rod cells are more abundant and more light sensitive than cone cells. Rods are sensitive over the entire visible spectrum. There are three types of cone cells, namely cone cells sensitive in the Red, Green, and Blue spectral range.
Human Eye Sensitivity to Different Lights
Three different vision regimes are shown in Fig. 16.2 along with the receptors relevant to each of the regimes (Osram Sylvania, 2000). Photopic vision relates to human vision at high ambient light levels (e.g. during daylight conditions) when vision is mediated by the cones. The photopic vision regime applies to luminance levels > 3 cd/m2. Scotopic vision relates to human vision at low ambient light levels (e.g. at night) when vision is mediated by rods. Rods have a much higher sensitivity than the cones. However, the sense of color is essentially lost in the scotopic vision regime. At low light levels such as in a moonless night, objects lose their colours and only appear to have different gray levels. The scotopic vision regime applies to luminance
levels < 0.003 cd/m2. Mesopic vision relates to light levels between the photopic and scotopic vision regime (0.003 cd/m2 < mesopic luminance < 3 cd/m2).
levels < 0.003 cd/m2. Mesopic vision relates to light levels between the photopic and scotopic vision regime (0.003 cd/m2 < mesopic luminance < 3 cd/m2).

The approximate spectral sensitivity functions of the rods and three types or cones are shown
in Fig. 16.3 (Dowling, 1987). Inspection of the figure reveals that night-time vision (scotopic
vision) is weaker in the red spectral range and thus stronger in the blue spectral range as
compared to day-time vision (photopic vision). The following discussion mostly relates to the
photopic vision regime.

Eye Sensitivity Function
The conversion between radiometric and photometric units is provided by the luminous efficiency function or eye sensitivity function, V(λ). In 1924, the CIE introduced the photopic eye sensitivity function V(λ) for point-like light sources where the viewer angle is 2° (CIE, 1931). This function is referred to as the CIE 1931 V(λ) function. It is the current photometric standard in the United States. A modified V(λ) function was introduced by Judd and Vos in 1978 (Vos, 1978; Wyszecki and Stiles, 1982, 2000) and this modified function is here referred to as the CIE 1978 V(λ) function. The modification was motivated by the underestimation of the human eye sensitivity in the blue and violet spectral region by the CIE 1931 V(λ) function. The modified function V(λ) has higher values in the spectral region below 460 nm. The CIE has endorsed the CIE 1978 V(λ) function by stating “the spectral luminous efficiency function for a point source may be adequately represented by the Judd modified V(λ) function” (CIE, 1988) and “the Judd modified
V(λ) function would be the preferred function in those conditions where luminance measurements of short wavelengths consistent with color normal observers is desired” (CIE, 1990).
V(λ) function would be the preferred function in those conditions where luminance measurements of short wavelengths consistent with color normal observers is desired” (CIE, 1990).

The CIE 1931 V(λ) function and the CIE 1978 V(λ) function are shown in Fig. 16.6. The photopic eye sensitivity function has maximum sensitivity in the green spectral range at 555 nm, where V(λ) has a value of unity, i.e. V(555 nm) = 1. Inspection of the figure also reveals that the CIE 1931 V(λ) function underestimated the eye sensitivity in the blue spectral range (λ < 460 nm). Also shown in Fig. 16.6 is the scotopic eye sensitivity function V ′(λ). The peak sensitivity in the scotopic vision regime occurs at 507 nm. This value is markedly shorter than the peak sensitivity in the photopic vision regime.
Note that even though the CIE 1978 V(λ) function is preferable, it is not the standard, mostly
for practical reasons such as possible ambiguities created by changing standards. Wyszecki and
Stiles (2000) note that even though the CIE 1978 V(λ) function is not a standard, it has been used
in several visual studies. The CIE 1978 V(λ) function, which can be considered the most accurate
description of the eye sensitivity in the photopic vision regime, is shown in Fig. 16.7.
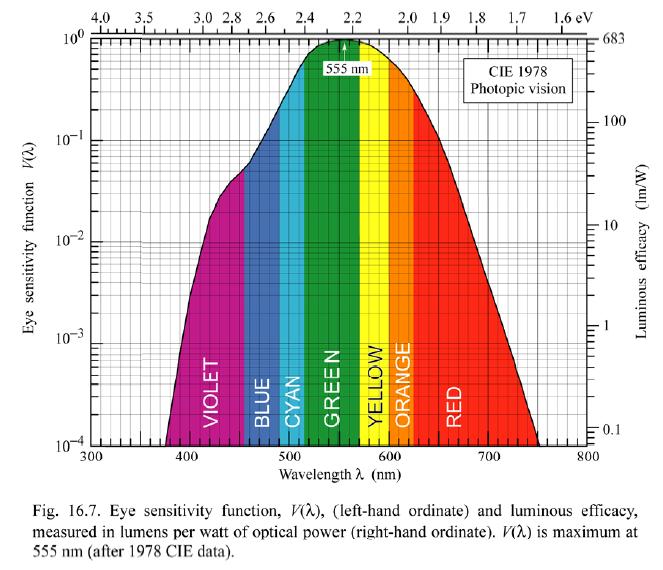
The eye sensitivity function has been determined by the minimum flicker method, which is the classic method for luminance comparison and for the determination of V(λ). The stimulus is a light-emitting small circular area, alternatingly illuminated (with a frequency of 15 Hz) with the standard color and the comparison color. Since the hue-fusion frequency is lower than 15 Hz, the hues fuse. However, the brightness-fusion frequency is higher than 15 Hz and thus if the two colors differ in brightness, then there will be visible flicker. The human subject’s task is to adjust the target color until the flicker is minimal. Any desired chromaticity can be obtained with an infinite variety of spectral power distributions P(λ). One of these distributions has the greatest possible luminous efficacy. This limit can be obtained in only one way, namely by the mixture of suitable intensities emitted by two monochromatic sources (MacAdam, 1950). The maximum attainable luminous efficacy obtained with a single monochromatic pair of emitters is shown in Fig. 16.8. The maximum luminous efficacy of white light depends on the color temperature; it is about 420 lm/W for a color temperature of 6500 K and can exceed 500 lm/W for lower color temperatures. The exact
value depends on the exact location within the white area of the chromaticity diagram.
 For wavelengths ranging from 390 to 720 nm, the eye sensitivity function V(λ) is greater than 10–3. Although the human eye is sensitive to light with wavelengths < 390 nm and > 720 nm, the sensitivity at these wavelengths is extremely low. Therefore, the wavelength range 390 nm ≤ λ ≤ 720 nm can be considered the visible wavelength range. The relationship between color and wavelength within the visible wavelength range is given in Table 16.5. This relationship is valid for monochromatic or near-monochromatic light sources such as LEDs. Note that color is, to some extent, a subjective quantity. Also note that the transition between
different colors is continuous.
value depends on the exact location within the white area of the chromaticity diagram.

different colors is continuous.